Curve Editor: Value Graph
Graph Editor Overview
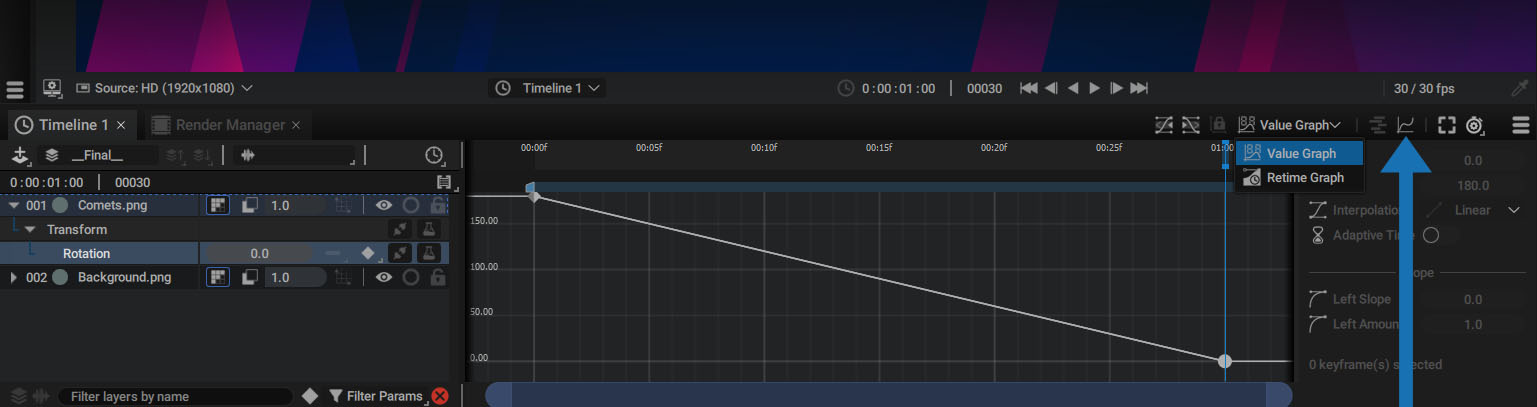
The Graph Editor is one of the Timeline modules. It is accessible on the right side via a button representing a curve.
Once activated, the right part of the Timeline is replaced by a graph where you can modify the interpolation of curves created from keyframes, as well as inspect the evolution of a parameter after Generators and Modifiers have been applied.
This module has 2 different modes:
- Value Graph: displays and controls the evolution of numerical parameters over time
- Retime Graph: displays and controls the evolution of a layer or spatial parameter along a Motion Path
This chapter will go over the Value Graph mode, and the next chapter will focus on the Retime Graph.
Displaying a Parameter in the Graph Editor:
To display the evolution of a parameter in the Graph Editor, select it in the Timeline or Inspector.
Depending on whether or not the parameter type selected is spatial, the Graph Editor will automatically switch to the Value Graph or Retime Graph.
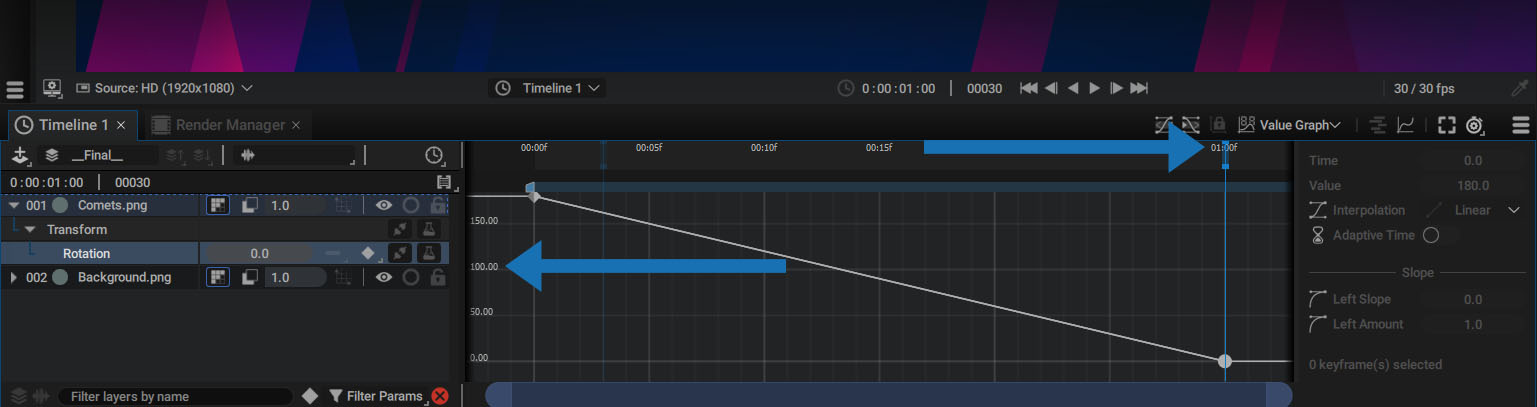
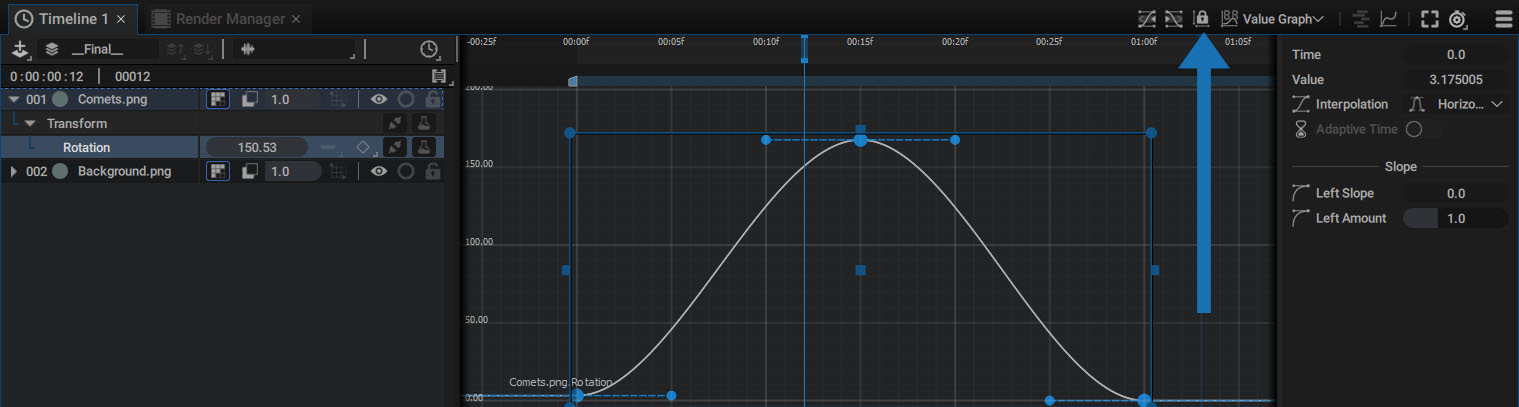
In the example above, the Layer Rotation is animated by two keyframes evolving from 180 to 0 degrees over a period of 1 second.
- The vertical scale represents the value in degrees: on the left, values rise to 180
- The horizontal scale represents time: on the right, the last keyframe is positioned at 1 second.
Navigating the Graph Editor:
If the vertical scale displays values from 0 to 180, that's because selecting the parameter automatically fits the graph editor between the keyframe with the highest value and the one with the lowest.
The shortcuts for moving and zooming in the graph are the same as those for moving in the Dope sheet, with a slight difference for zooming.
-
Panning (in all directions):
- Space + Left Button
- Middle Button
- Alt/Option + Left Button
-
Zoom:
- Alt/Option + Mouse wheel: zoom/unzoom only horizontally until the entire composition is visible, then zoom/unzoom vertically
- Mouse wheel: zoom in and out both horizontally and vertically
- Ctrl/Cmd + Alt/Option + Left Button: the direction taken by the mouse will define whether the zoom is horizontal or vertical
- F key to fit the current selection
You can also use the scroll bars at the bottom.
Warning
Shortcuts in Autograph are contextual and dependent on mouse position. These shorcuts are valid when your mouse cursor is over the Graph Editor.
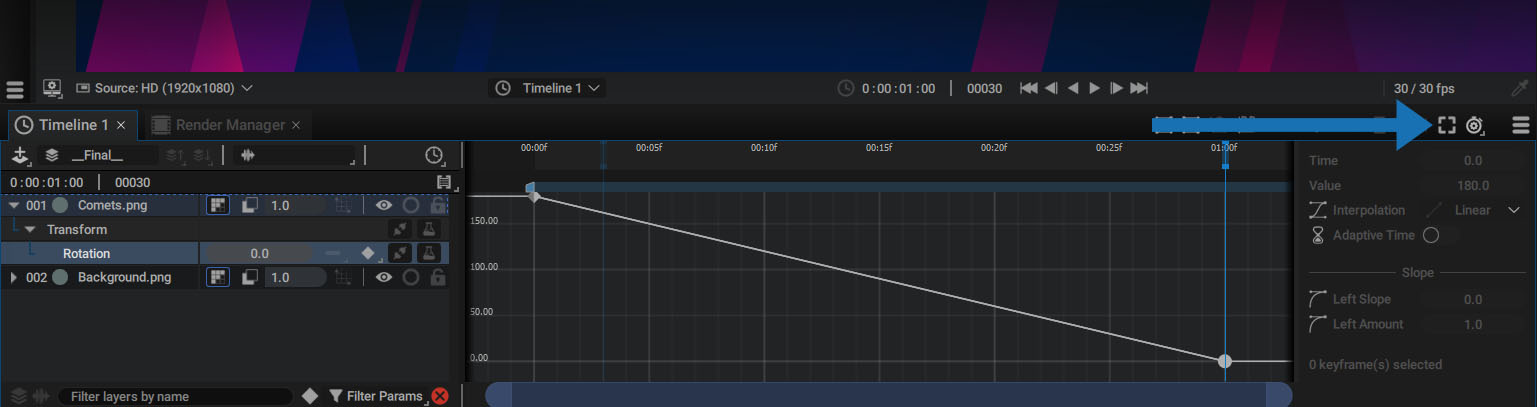
A button at the top right of the panel allows you to fit the current selection, rather than pressing the F key.
Keyframe Properties Dock
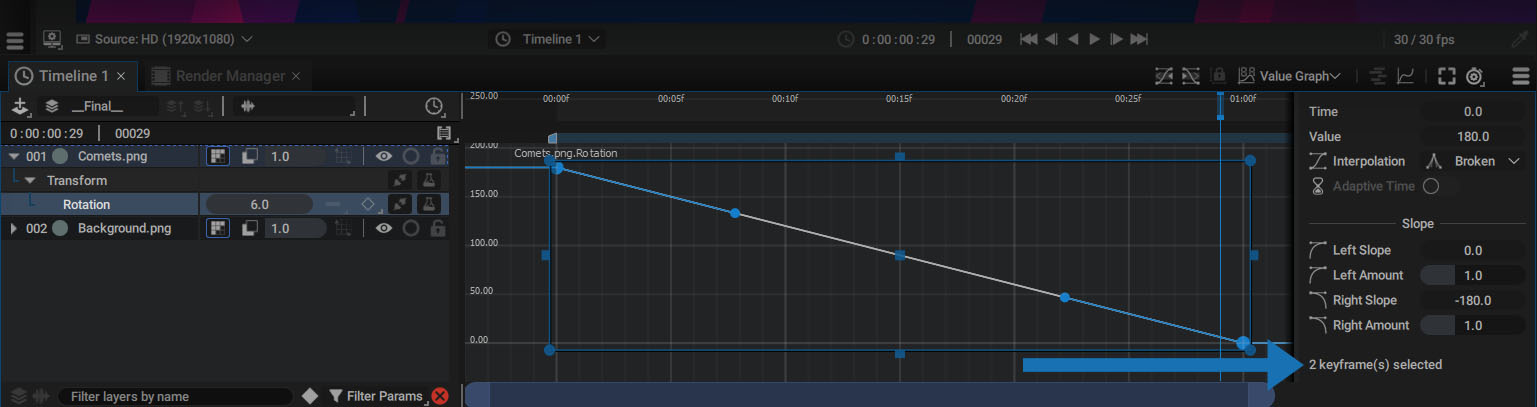
On the right, the Curve Editor permanently displays the Keyframe Properties Dock already mentioned in the Keyframe section.
This dock displays information on the selected key. If several keys are selected, the one furthest to the left is displayed, even if the dock shows that two keyframes are selected.
Warning
If several keyframes are selected, any changes made in the Dock will be applied to all these keys.
Analyzing the Rotation animation in the Value Graph is easy to understand, as we've selected a single parameter made up of a single dimension for a 2D layer.
Selecting a key displays the following parameters:
- Time: the time at which the key is located, defined in seconds
- Value: the parameter value stored in the key
- Interpolation: the interpolation type assigned to the key
- Adaptive Time: switches a key to Adaptive mode whenever possible
The Slope section defines the tangent parameters displayed on either side of the point.
- Left Slope: tangent slope to the left of the point
- Left Amount: tangent tension defined by its length
- Right Slope: tangent slope to the right of the point
- Right Amount: tangent tension defined by its length
Warning
Depending on the interpolation assigned to a keyframe, the Left or Right parameters may not appear in the dock.
Changing Keyframe Interpolation:
Interpolation of selected points can be changed during playback to quickly test the available modes.
Press the middle button to scroll through the list without having to click on the scroll bar:
In the video above, the Play Visible Range option has been activated to loop only what is displayed in the Graph Editor.
Manual Tangent and Point Adjustment
Keyframe values can be modified in the Keyframe Properties Dock or by manipulating graph points directly.
- Moving a point horizontally changes its Time parameter
- Moving a point vertically changes its Value
Moving a Keyframe Between Images:
The high precision with which these values can be modified allows you to place a keyframe between two images in the composition. But just like with Layer Time Offsets, pressing the Ctrl/Cmd key while moving a point allows you to move a key between two frames.
In the video below, the point is first moved without the Ctrl/Cmd key, snapping it to the nearest frame, then this key is pressed while moving.
Adding a Point on Curve:
To add a point to a curve, press the Alt/Option key and click on it.
In the video above, we also switch all keyframes to Horizontal mode to create acceleration and deceleration between each point.
Handling Several Points using the Control Box:
Selecting several keyframes with a selection rectangle brings up a control box.
- Handles on edges stretch points and their tangents, horizontally or vertically
- The box corners evenly resize the whole box
- Central point moves all points
Restrict Movement to One Dimension:
By default, the center point can be manipulated in any direction. But a button at the top of the Curve Editor allows you to constrain point movement to one axis only.
This axis is automatically defined according to mouse direction.
Manually Tweaking Tangents:
Shortcuts used to manipulate tangents are the same as those used to edit points on a Motion Path.
- Press the Alt/Option key then click and drag the point to draw a new tangent
- Press the Ctrl/Cmd key then a tangent click and drag a tangent point to break them
Working on Several Separated Dimensions
The Curve Editor in Value Graph mode is not really recommended for working with spatial parameters in Unified mode (which is the default for Position).
This is why it automatically switches to Retime Graph mode when this type of parameter is selected.
However, if Position is switched to Separated mode, each parameter is 1D and can be manipulated independently.
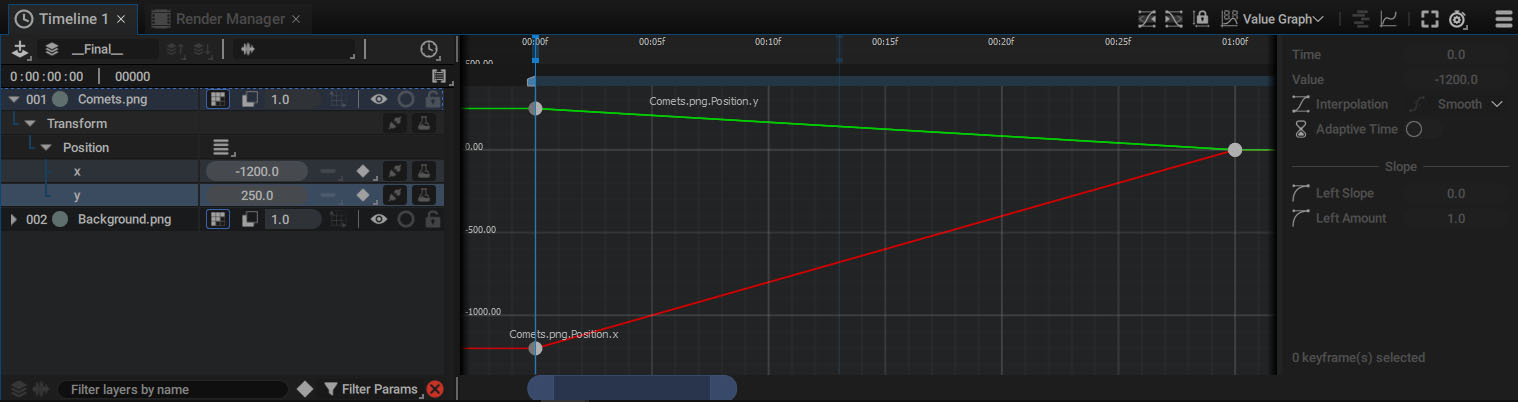
Colors are used to differentiate dimensions:
- X: Red
- Y: Green
- Z: Blue (for 3D layers and items, such as mesh layers, cameras, and lights)
Parameter names are displayed next to the corresponding curves.
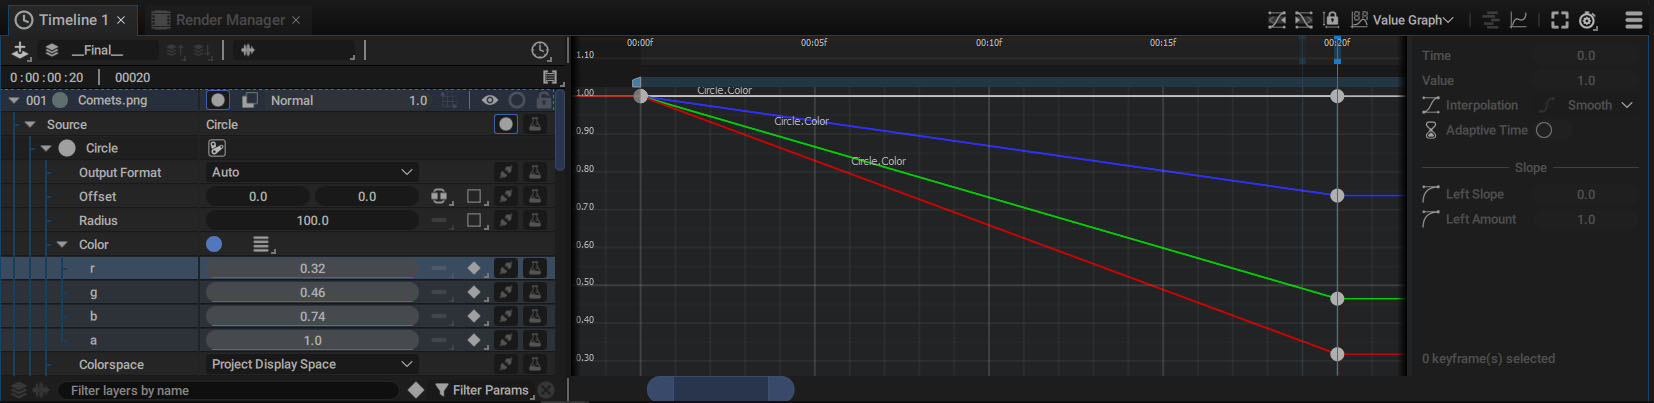
Color parameters in Separated mode will be represented by Red, Green, Blue and White curves for the Alpha channel. Below is a Circle Generator color parameter.
Inspecting Parameters using Generators and Modifiers
Selecting a parameter allows you to display its animation curve, regardless of the way you animate it:
- Keyframes
- Generators
- Modifiers
Generators:
By adding a Noise Generator on a Rotation, the Graph Editor will display its evolution over time.
Once this Generator has been added, we can click on the Rotation parameter again to see its evolution, then access the Noise parameters.
Modifiers:
The same is true if this parameter is animated with keyframes, while undergoing modifications by adding a Modifier.
Once again, a Noise Modifier is added to the keyframe animation:
Note
Two curves are displayed in the Graph Editor. The solid curve represents the original movement created by the keyframes, while the dotted one represents the movement after the Modifier has been applied.